Trend Scanning

Trend Scanning is both a classification and regression labeling technique introduced by Marcos Lopez de Prado in the following lecture slides: Advances in Financial Machine Learning: Lecture 3/10 (seminar slides), and again in his text book Machine Learning for Asset Managers.

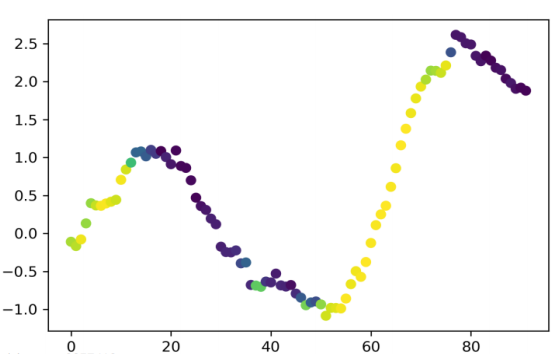
Result of applying backward-looking Trend scanning to EEM ETF daily close prices. The colour of a point in the plot represents the t-value.
For some trading algorithms, the researcher may not want to explicitly set a fixed profit / stop loss level, but rather detect overall trend direction and sit in a position until the trend changes. For example, market timing strategy which holds ETFs except during volatile periods. Trend scanning labels are designed to solve this type of problems.
This algorithm is also useful for defining market regimes between downtrend, no-trend, and uptrend.
Implementation in the MlFinLab package supports both forward-looking and backward-looking window approaches.
The idea of forward-looking trend-scanning labels are to fit multiple regressions from time t to t + L (L is a maximum observation window) and select the one which yields maximum t-value for the slope coefficient, for a specific observation. For the backward-looking trend-scanning labels the regressions are fit from time t to t - L.
Tip
Classification: By taking the sign of t-value for a given observation we can set {-1, 1} labels to define the trends as either downward or upward.
Classification: By adding a minimum t-value threshold you can generate {-1, 0, 1} labels for downward, no-trend, upward.
The t-values can be used as sample weights in classification problems.
Regression: The t-values can be used in a regression setting to determine the magnitude of the trend.
The output of this algorithm is a DataFrame with t1 (time stamp for the farthest observation), t-value, returns for the trend, and bin. The user can also specify MAE/MSE metric used to define best-fit linear regression by change the value of metric parameter in the function call.
Note
Underlying Literature
The following sources elaborate extensively on the topic:
Advances in Financial Machine Learning: Lecture 3/10 (seminar slides) by Marcos Lopez de Prado.
Machine Learning for Asset Managers by Marcos Lopez de Prado.
Implementation
Implementation of Trend-Scanning labels described in Advances in Financial Machine Learning: Lecture 3/10
- trend_scanning_labels(price_series: Series, t_events: list | None = None, observation_window: int = 20, metric: str = 't_value', look_forward: bool = True, min_sample_length: int = 5, step: int = 1) DataFrame
Trend scanning is both a classification and regression labeling technique.
That can be used in the following ways:
Classification: By taking the sign of t-value for a given observation we can set {-1, 1} labels to define the trends as either downward or upward.
Classification: By adding a minimum t-value threshold you can generate {-1, 0, 1} labels for downward, no-trend, upward.
The t-values can be used as sample weights in classification problems.
Regression: The t-values can be used in a regression setting to determine the magnitude of the trend.
The output of this algorithm is a DataFrame with t1 (time stamp for the farthest observation), t-value, returns for the trend, and bin.
This function allows using both forward-looking and backward-looking window (use the look_forward parameter).
- Parameters:
price_series – (pd.Series) Close prices used to label the data set.
t_events – (list) Filtered events, array of pd.Timestamps.
observation_window – (int) Maximum look forward window used to get the trend value.
metric – (str) Metric used to define top-fit regression. Either ‘t_value’, ‘mean_squared_error’ or ‘mean_absolute_error’.
look_forward – (bool) True if using a forward-looking window, False if using a backward-looking one.
min_sample_length – (int) Minimum sample length used to fit regression.
step – (int) Optimal t-value index is searched every ‘step’ indices.
- Returns:
(pandas.DataFrame) DataFrame consisting of the columns t1, t-value, ret, bin.
Index - (pd.Timestamp) TimeIndex of the labels.
t1 - (pd.Timestamp) Label end-time where the observed trend has the highest t-value i.e. end of a strong upward trend (for look forward) and start of a strong downward trend (for look backward).
t-value - (float) Sign of t-value represents the direction of the trend. Positive t-value represents upwards trend.
ret - (float) Price change percentage from index time to label end time.
bin - (int) Binary label value based on sign of price change.
Example
import yfinance as yf
import matplotlib.pyplot as plt

# Import MlFinLab tools
from mlfinlab.labeling.trend_scanning import trend_scanning_labels

# Loading EEM ETF daily close prices during the financial crises
eem_close = yf.download(
    tickers="EEM", start="2008-07-01", end="2009-07-01", interval="1d"
)["Adj Close"]

# Getting indexes that we want to label
t_events = eem_close.index

# Fitting regressions to various windows up to 20 days back, using a minimum sample length of 5
tr_scan_labels = trend_scanning_labels(
    eem_close, t_events, observation_window=20, look_forward=False, min_sample_length=5
)

# Plotting the results
fig = plt.figure(figsize=(12, 7))
plt.scatter(x=eem_close.index, y=eem_close.values, c=tr_scan_labels["t_value"], s=200)
plt.show()