Excess Over Median
In this method, a cross-sectional dataset of close prices of many different stocks are used, which is converted to returns. The median return at each time index is calculated and used as a proxy for market return. The median return is then subtracted from each observation’s return to find the numerical excess return over median. If desired, the numerical values can be converted to categorical values according to the sign of the excess return. The labels can then be used in training regression and classification models.
At time \(t\):
If categorical rather than numerical labels are desired:
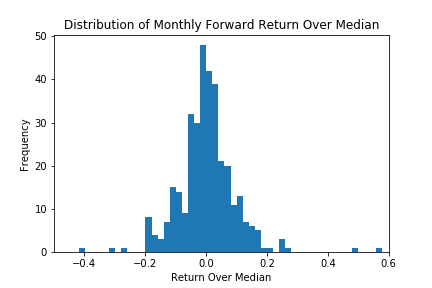
If desired, the user can specify a resampling period to apply to the price data prior to calculating returns. The user can also lag the returns to make them forward-looking. In the paper by Zhu et al., the authors use monthly forward-looking labels.

Distribution of monthly forward stock returns. This is the labeling method used in the paper by Zhu et al.
Note
Underlying Literature
The following sources elaborate extensively on the topic:
-
The benefits of tree-based models for stock selection by Zhu, M., Philpotts, F. and Stevenson, M.
Implementation
Return in excess of median method.
Described in “The benefits of tree-based models for stock selection”, Zhu et al. (2012). Data labeled this way can be used in regression and classification models to predict stock returns over market.
- excess_over_median(prices, binary=False, resample_by=None, lag=True)
-
Return in excess of median labeling method. Sourced from “The benefits of tree-based models for stock selection” Zhu et al. (2012).
Returns a DataFrame containing returns of stocks over the median of all stocks in the portfolio, or returns a DataFrame containing signs of those returns. In the latter case, an observation may be labeled as 0 if it itself is the median.
- Parameters:
-
-
prices – (pd.DataFrame) Close prices of all stocks in the market that are used to establish the median. Returns on each stock are then compared to the median for the given timestamp.
-
binary – (bool) If False, the numerical value of excess returns over median will be given. If True, then only the sign of the excess return over median will be given (-1 or 1). A label of 0 will be given if the observation itself is the median. According to Zhu et al., categorical labels can alleviate issues with extreme outliers present with numerical labels.
-
resample_by – (str) If not None, the resampling period for price data prior to calculating returns. ‘B’ = per business day, ‘W’ = week, ‘M’ = month, etc. Will take the last observation for each period. For full details see here.
-
lag – (bool) If True, returns will be lagged to make them forward-looking.
-
- Returns:
-
(pd.DataFrame) Numerical returns in excess of the market median return, or sign of return depending on whether binary is False or True respectively.
Example
Below is an example on how to create labels of excess over median from real data.
# Import packages
import yfinance as yf

# Import MlFinLab tools
from mlfinlab.labeling.excess_over_median import excess_over_median

# Import price data.
tickers = "AAPL MSFT AMZN GOOG"
data = yf.download(tickers, start="2010-01-01", end="2022-01-01")["Adj Close"]

# Get returns over median numerically
numerical = excess_over_median(prices=data, binary=False, resample_by=None, lag=False)

# Get returns over median as a categorical label
binary = excess_over_median(prices=data, binary=True, resample_by=None, lag=False)

# Get monthly forward-looking returns
monthly_forward = excess_over_median(
    prices=data, binary=True, resample_by="M", lag=True
)
Research Notebook
The following research notebooks can be used to better understand labeling excess over median.
Excess Over Median Example