Excess Over Mean
Using cross-sectional data on returns of many different stocks, each observation is labeled according to whether, or how much, its return exceeds the mean return. It is a common practice to label observations based on whether the return is positive or negative. However, this may produce unbalanced classes, as during market booms the probability of a positive return is much higher, and during market crashes they are lower (Coqueret and Guida, 2020). Labeling according to a benchmark such as mean market return alleviates this issue.
A dataframe containing forward returns is calculated from close prices. The mean return of all stocks at time \(t\) in the dataframe is used to represent the market return, and excess returns are calculated by subtracting the mean return from each stock’s return over the time period \(t\). The numerical returns can then be used as-is (for regression analysis), or can be relabeled to represent their sign (for classification analysis).
At time \(t\):
If categorical rather than numerical labels are desired:
If desired, the user can specify a resampling period to apply to the price data prior to calculating returns. The user can also lag the returns to make them forward-looking.
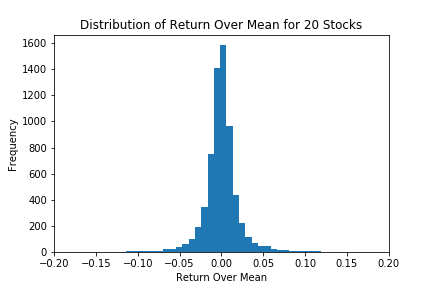
The following shows the distribution of numerical excess over mean for a set of 20 stocks for the time period between Jan 2019 and May 2020.

Distribution of returns over mean for 20 stocks.
Note
Underlying Literature
The following sources elaborate extensively on the topic:
-
Machine Learning for Factor Investing, Chapter 5.5.1 by Coqueret, G. and Guida, T.
Implementation
Return in excess of mean method.
Chapter 5, Machine Learning for Factor Investing, by Coqueret and Guida, (2020).
- excess_over_mean(prices, binary=False, resample_by=None, lag=True)
-
Return in excess of mean labeling method. Sourced from Chapter 5.5.1 of Machine Learning for Factor Investing, by Coqueret, G. and Guida, T. (2020).
Returns a DataFrame containing returns of stocks over the mean of all stocks in the portfolio. Returns a DataFrame of signs of the returns if binary is True. In this case, an observation may be labeled as 0 if it itself is the mean.
- Parameters:
-
-
prices – (pd.DataFrame) Close prices of all tickers in the market that are used to establish the mean. NaN values are ok. Returns on each ticker are then compared to the mean for the given timestamp.
-
binary – (bool) If False, the numerical value of excess returns over mean will be given. If True, then only the sign of the excess return over mean will be given (-1 or 1). A label of 0 will be given if the observation itself equal to the mean.
-
resample_by – (str) If not None, the resampling period for price data prior to calculating returns. ‘B’ = per business day, ‘W’ = week, ‘M’ = month, etc. Will take the last observation for each period. For full details see here.
-
lag – (bool) If True, returns will be lagged to make them forward-looking.
-
- Returns:
-
(pd.DataFrame) Numerical returns in excess of the market mean return, or sign of return depending on whether binary is False or True respectively.
Example
Below is an example on how to create labels of excess over mean.
# Import packages
import yfinance as yf

# Import MlFinLab tools
from mlfinlab.labeling.excess_over_mean import excess_over_mean

# Import packages
import yfinance as yf

# Import MlFinLab tools
from mlfinlab.labeling.excess_over_median import excess_over_median

# Import price data.
tickers = "AAPL MSFT AMZN GOOG"
data = yf.download(tickers, start="2010-01-01", end="2022-01-01")["Adj Close"]

# Get returns over median numerically
numerical = excess_over_median(prices=data, binary=False, resample_by=None, lag=False)

# Get returns over median as a categorical label
binary = excess_over_median(prices=data, binary=True, resample_by=None, lag=False)

# Get monthly forward-looking returns
monthly_forward = excess_over_median(
    prices=data, binary=True, resample_by="M", lag=True
)


# Get returns over mean numerically.
numerical = excess_over_mean(prices=data, lag=True)

# Get returns over mean as a categorical label.
categorical = excess_over_mean(prices=data, binary=True, lag=True)

# Get categorical forward looking monthly labels.
labels = excess_over_mean(prices=data, binary=True, resample_by="M", lag=True)
Research Notebook
The following research notebooks can be used to better understand labeling excess over mean.
Excess Over Mean Example